Toggle navigation
Home
Contact
Login
Register
Home
Category : IT and AI
Category : IT and AI
10
11
12
13
14
15
16
17
Popular Posts
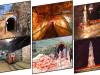
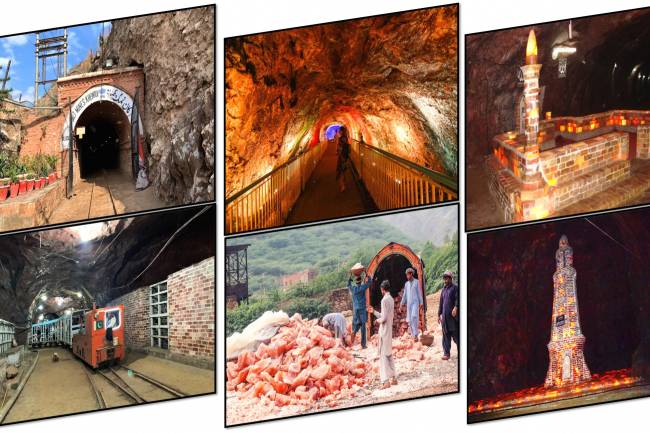
Khewra Mine Salt
28.12.2023
0 Comments
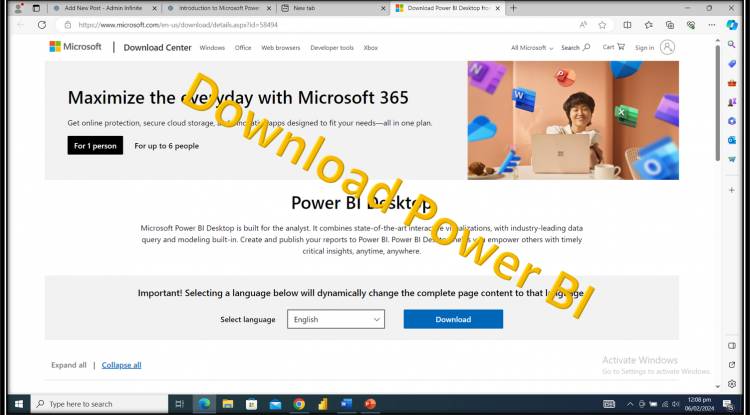
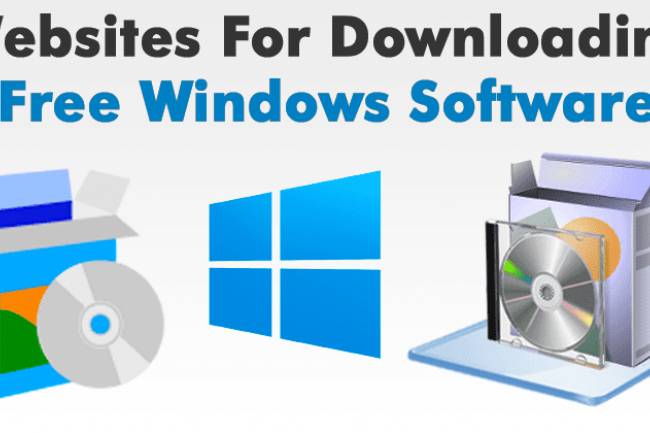
free software download websites for pc
21.09.2023
0 Comments
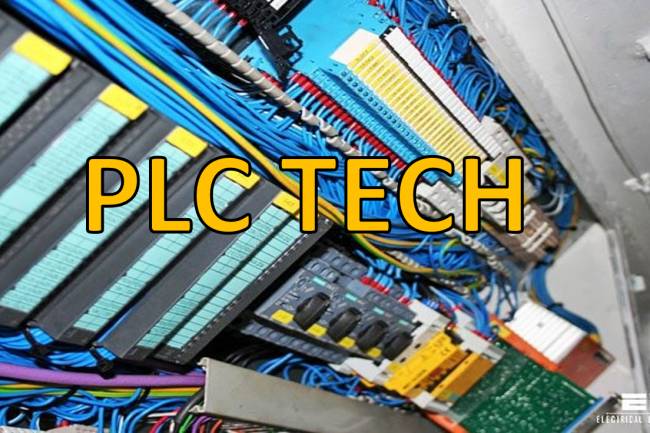
10 Latest PLC Technology Trends
21.10.2023
0 Comments
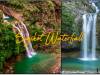
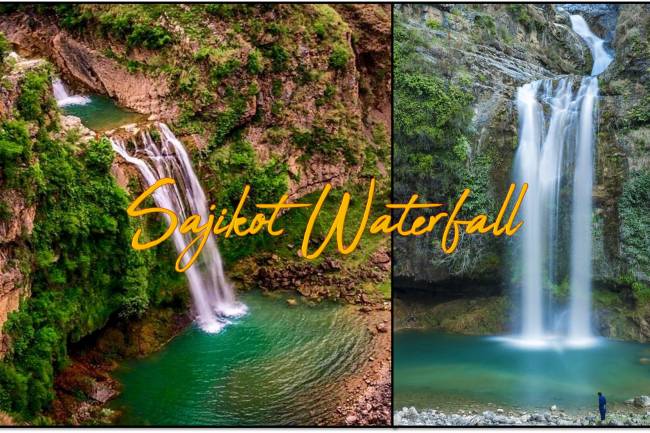
Waterfalls: Sajikot Waterfall
05.12.2023
0 Comments
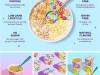
Magic Spoon Cereal Review
28.10.2023
0 Comments
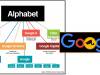
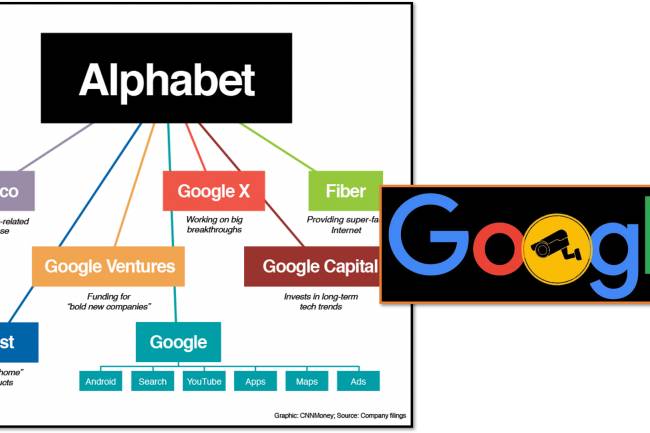
Google history: When Was Google Founded and By Whom?
31.10.2024
0 Comments
Categories
AUTO
(23)
HEALTH news
(130)
TECH
(12)
SCIENCE
(0)
SOCIAL MEDIA
(0)
PRESS RELEASES
(0)
TESTIMONIALS (References)
(6)
BIO
(1)
SPORTS
(12)
EARNING ONLINE
(0)
ARCHITECTURE
(2)
IT and AI
(98)
Accessories
(3)
News
(77)
Pet
(15)
Programming
(5)
Shopping
(18)
Visiting Place News
(24)
Foods & Candies
(60)
Style and Fashion news
(32)
Geography News
(10)
Personalities News
(4)
Entertainment News
(5)
Islamic News
(1)
Art news
(5)
Green
(2)
Arabic news
(0)
Random Posts
IT and AI
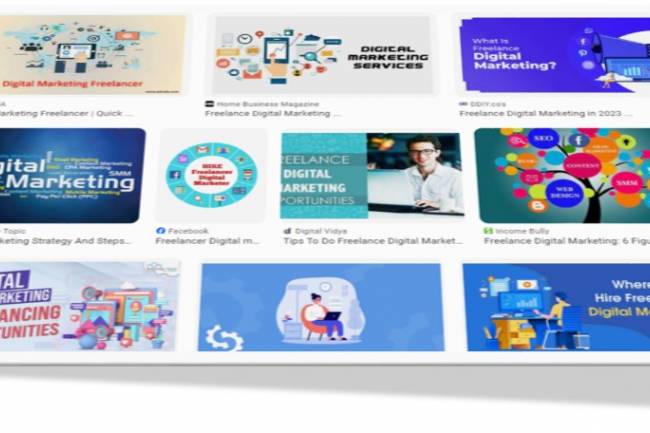
Freelance Digital Marketing | Digital Marketing
HEALTH news
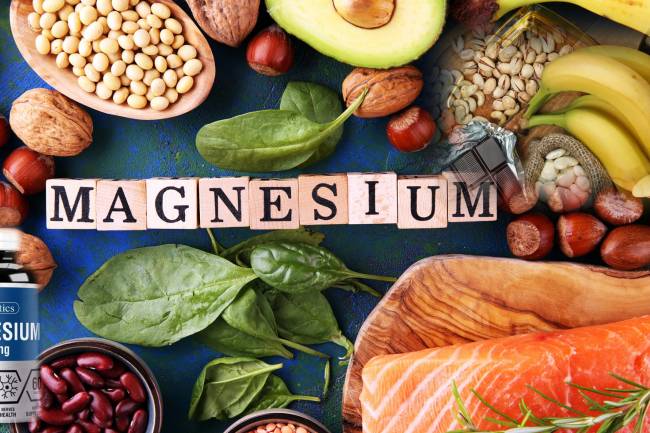
Urgent Importance of Magnesium in Your Diet
Foods & Candies
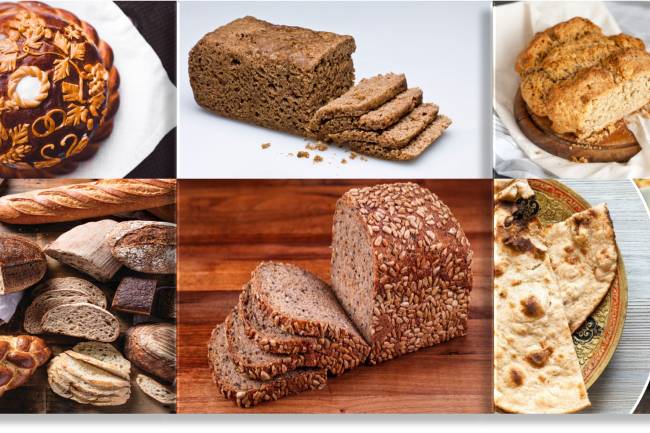
The 50 Most Delicious Breads in the World
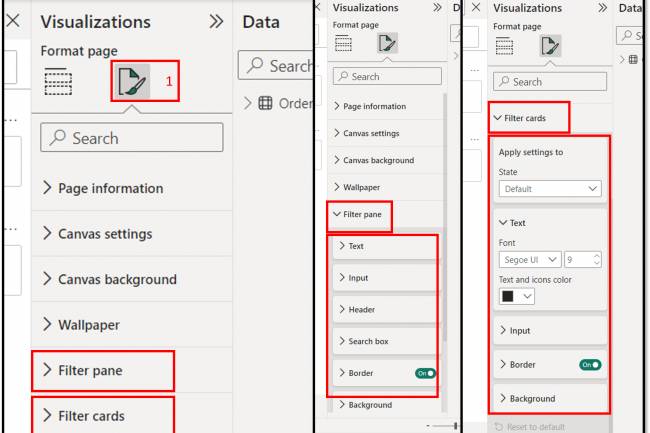
IT and AI
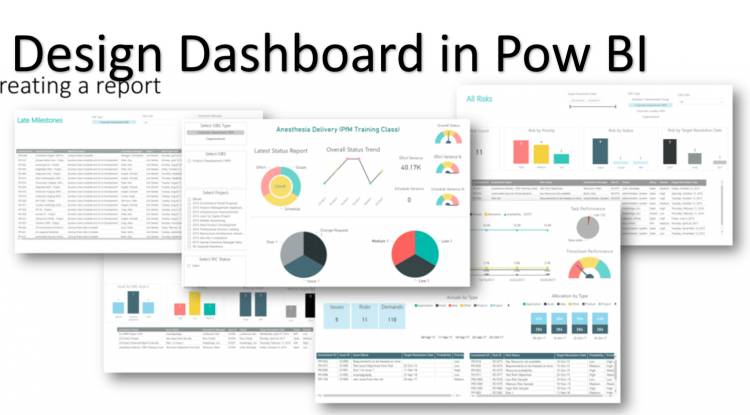
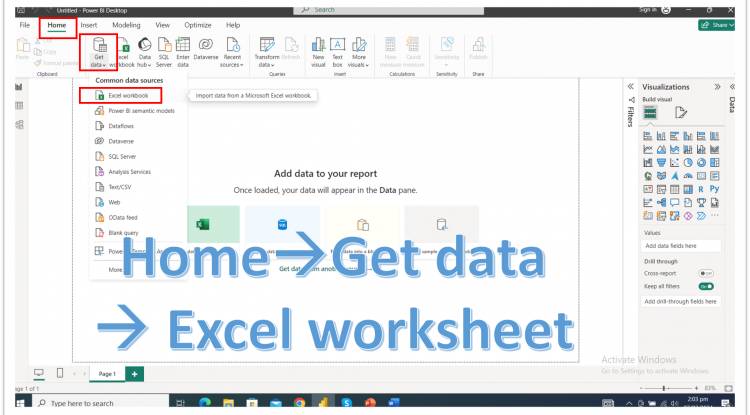
Page Formatting Filter Pane and Filter cards: Format Your Report Page...
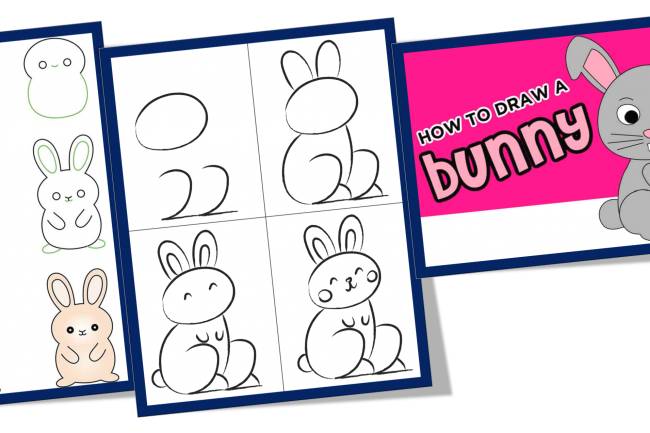
Art news
How to Draw a Bunny
Tags
Game highlights
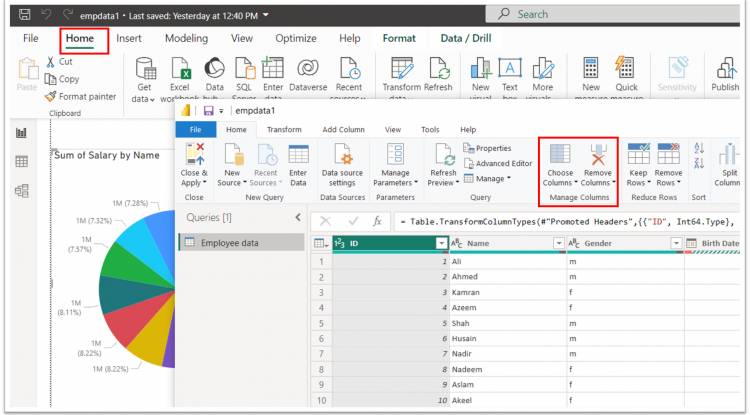
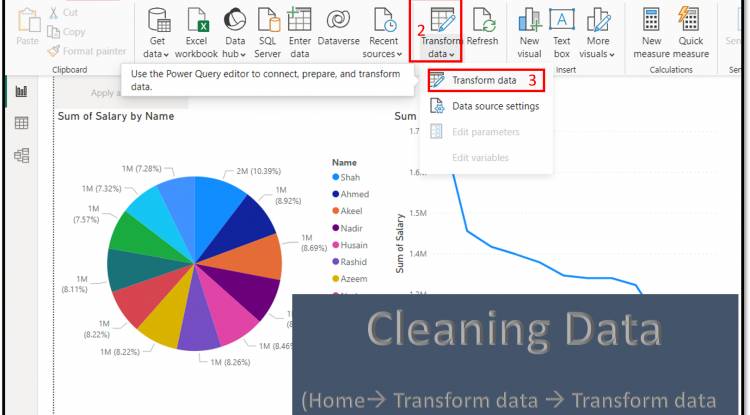
Power Query
Apples and nutrient absorption
Infinity Chili
Mandarins
Gaming
Minerals
Avian influenza
Health tips.
Top eleven
ArtInManchester
PLC in Robotic Painting
Generative AI
Scented oils in antiquity
sleepwalking causes
Your browser does not support the canvas element.