Toggle navigation
Home
Contact
Login
Register
Home
Tag : Time Series Visualization
Tag : Time Series Visualization
Popular Posts
Khewra Mine Salt
28.12.2023
0 Comments
Waterfalls: Sajikot Waterfall
05.12.2023
0 Comments
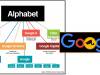
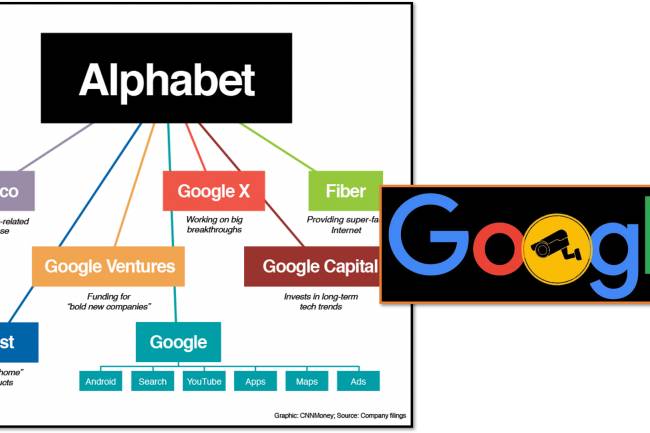
Google history: When Was Google Founded and By Whom?
31.10.2024
0 Comments
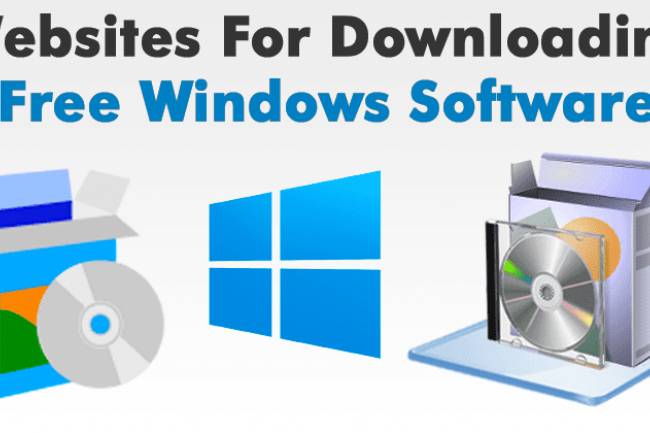
free software download websites for pc
21.09.2023
0 Comments
10 Latest PLC Technology Trends
21.10.2023
0 Comments
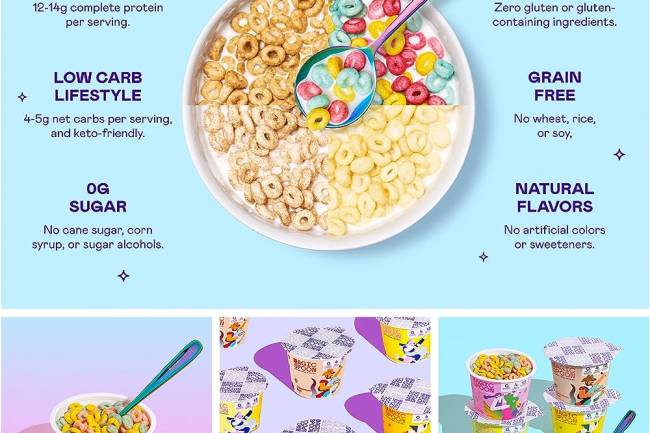
Magic Spoon Cereal Review
28.10.2023
0 Comments
Categories
AUTO
(23)
HEALTH and Food
(195)
TESTIMONIALS (References)
(0)
SPORTS
(12)
IT and AI
(70)
Accessories
(0)
News
(167)
Pet
(15)
Visiting Place News
(24)
Style and Fashion news
(25)
Geography News
(0)
Entertainment News
(0)
Random Posts
News
Coachella arts festival held annually at the Empire Polo Club in Indio,...
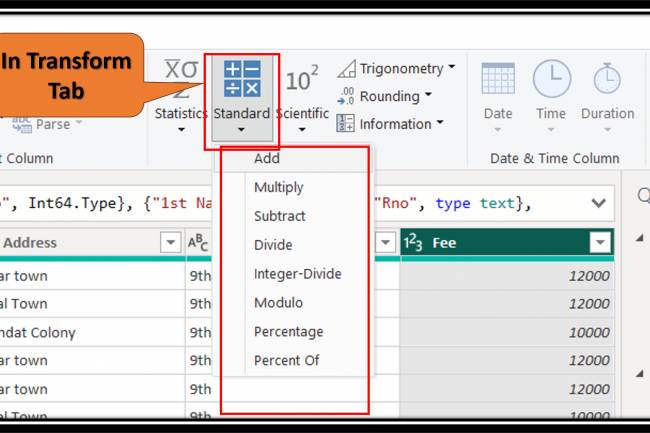
IT and AI
Transform Tab in Query Editor: The "standard" options in Power BI's Query...
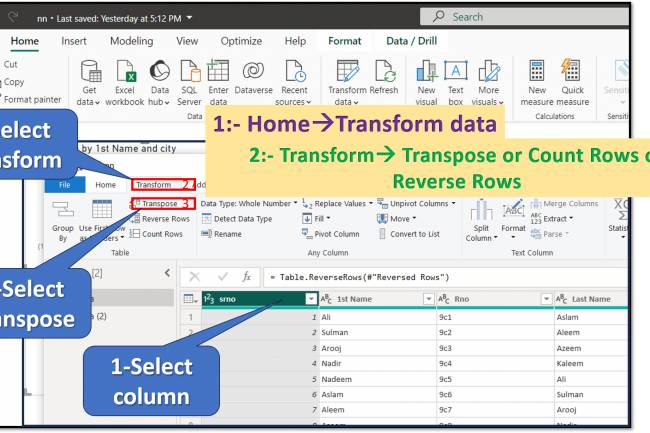
IT and AI
Transform Tab in Query Editor: Transpose, Reverse Row and Count Rows in...
HEALTH and Food
The Ultimate Guide to Perfectly Baked Cookies
IT and AI
Accountability and transparency with detailed AI visions
Tags
touch-sensitive-controls
Healthcare provider consultation
Printing Press
Google Meet
Magnesium sulfate for nutrient absorption
sculpted aerodynamic body
university policies
Apples' vitamin content
#UnderstatedGlamNails
advanced aerodynamics
5G Network Revolution
AFC 2023 Schedule
Remembering a great player
solar coronagraph
Macaw Habitat
Your browser does not support the canvas element.