Toggle navigation
Home
Contact
Login
Register
Home
Tag : Histograms
Tag : Histograms
Popular Posts
Khewra Mine Salt
28.12.2023
0 Comments
Waterfalls: Sajikot Waterfall
05.12.2023
0 Comments
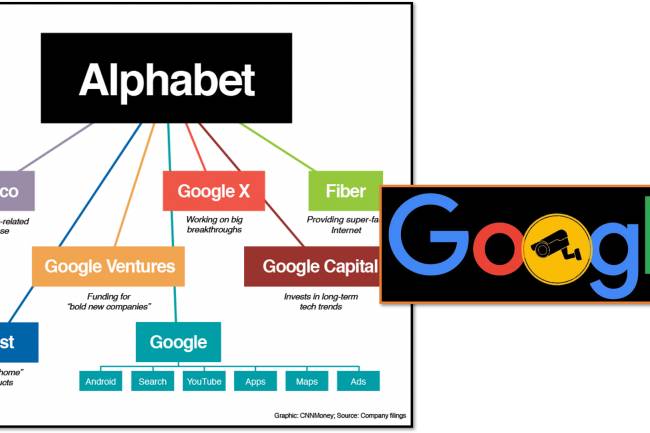
Google history: When Was Google Founded and By Whom?
31.10.2024
0 Comments
free software download websites for pc
21.09.2023
0 Comments
10 Latest PLC Technology Trends
21.10.2023
0 Comments
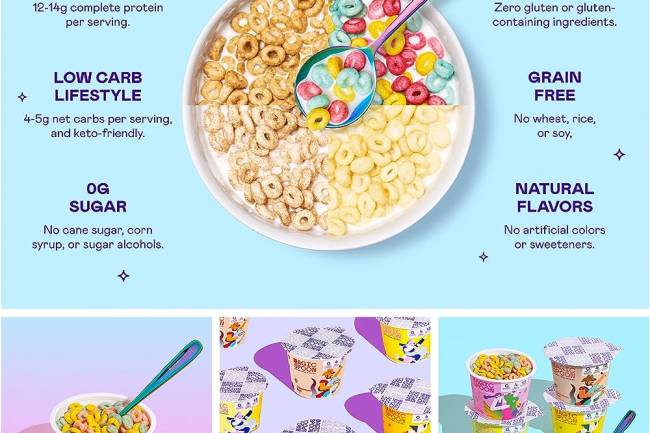
Magic Spoon Cereal Review
28.10.2023
0 Comments
Categories
AUTO
(23)
HEALTH and Food
(195)
TESTIMONIALS (References)
(0)
SPORTS
(12)
IT and AI
(70)
Accessories
(0)
News
(167)
Pet
(15)
Visiting Place News
(24)
Style and Fashion news
(25)
Geography News
(0)
Entertainment News
(0)
Random Posts
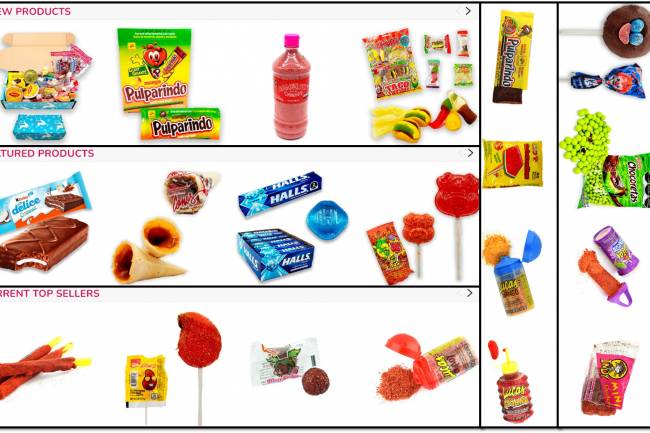
HEALTH and Food
Mexican Candy
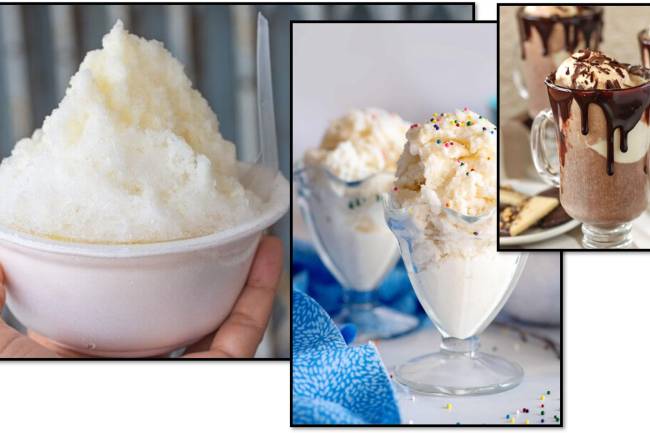
HEALTH and Food
Snow Cream Recipe (Ice Cream Recipe)
HEALTH and Food
30 Great Recipes Using Only Freezer Essentials
IT and AI
windows defender | security warning | Recovery | image with Update
News
AI Model Optimization
Tags
LDL cholesterol
Graphical performance
recyclable-materials
Data
lower manhattan
Skin Elasticity.
Apples for prediabetes
Efficiency
Spicy Chili
Ujjayi breathing
Stunning Pakistani cascades
#creativebraids
Mohamed Salah
Nature Conservation
Ordsall Hall
Your browser does not support the canvas element.