Toggle navigation
Home
Contact
Login
Register
Home
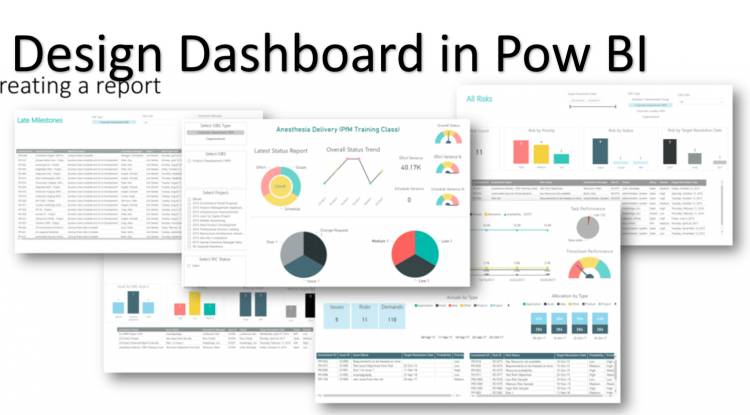
Tag : Graphical representation
Tag : Graphical representation
Popular Posts
Khewra Mine Salt
28.12.2023
0 Comments
Waterfalls: Sajikot Waterfall
05.12.2023
0 Comments
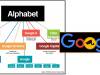
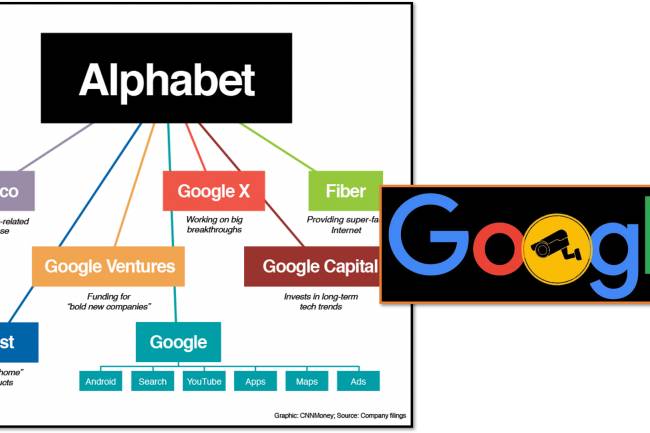
Google history: When Was Google Founded and By Whom?
31.10.2024
0 Comments
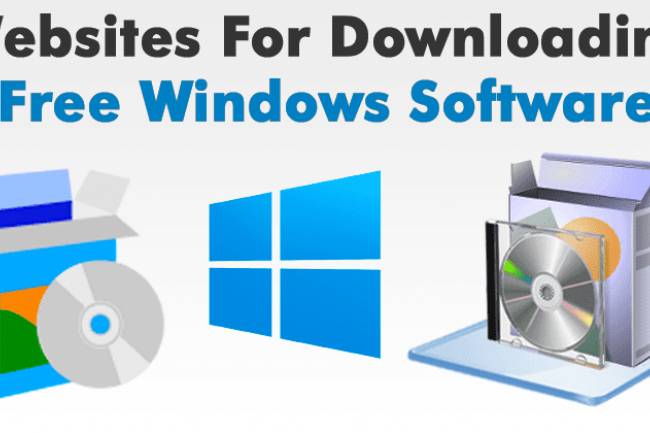
free software download websites for pc
21.09.2023
0 Comments
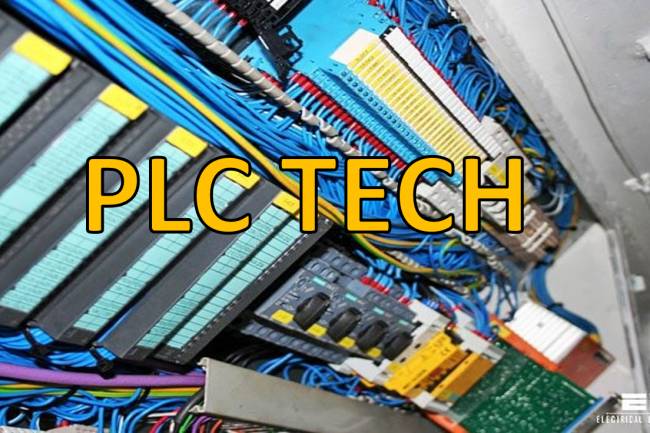
10 Latest PLC Technology Trends
21.10.2023
0 Comments
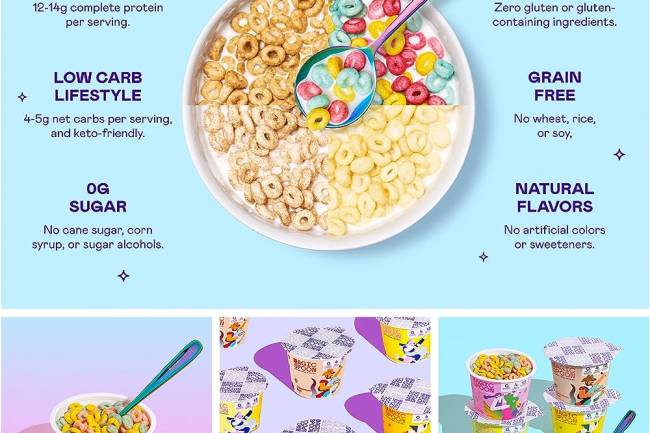
Magic Spoon Cereal Review
28.10.2023
0 Comments
Categories
AUTO
(23)
HEALTH and Food
(195)
TESTIMONIALS (References)
(0)
SPORTS
(12)
IT and AI
(70)
Accessories
(0)
News
(167)
Pet
(15)
Visiting Place News
(24)
Style and Fashion news
(25)
Geography News
(0)
Entertainment News
(0)
Random Posts
HEALTH and Food
Cozy Mixing (Cozymaxxing): how to Reduce Stress
News
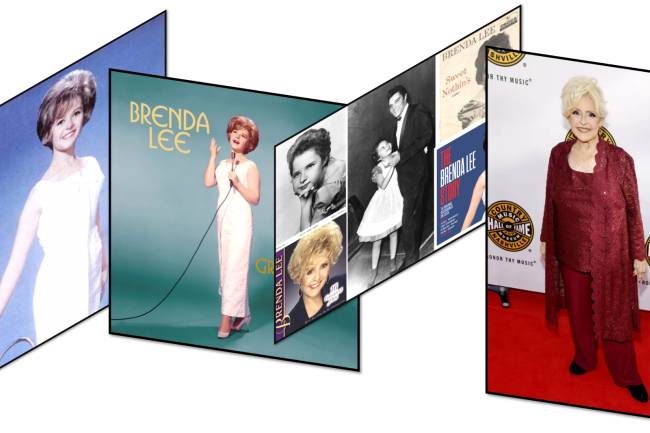
Brenda Lee: How Tall is Brenda Lee
News
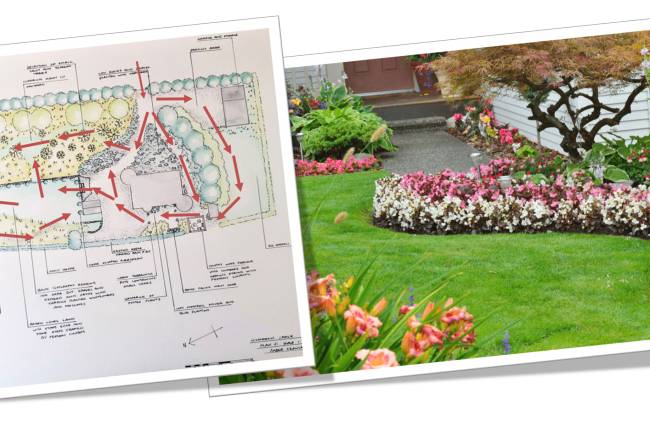
Garden Designing Techniques
IT and AI
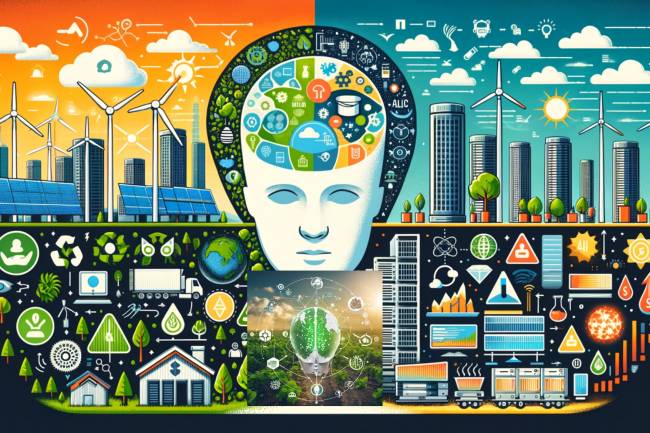
Social Sustainability of AI
HEALTH and Food
Egg White Good for You Everyday
Tags
Black Coffee
Data integrity constraints
PLC in CNC Micro Drilling
at-home spa
Row Sorting
Kentucky heavy rain
heel pain insoles
Genetic Modification
Arch Support
Dreams Come True
Text Box Shape
genetic medicine
Dietary Enhancement
default browser setup
Filter Pane Font Size
Your browser does not support the canvas element.