Toggle navigation
Home
Contact
Login
Register
Home
Tag : Force-directed Graphs
Tag : Force-directed Graphs
Popular Posts
Khewra Mine Salt
28.12.2023
0 Comments
Waterfalls: Sajikot Waterfall
05.12.2023
0 Comments
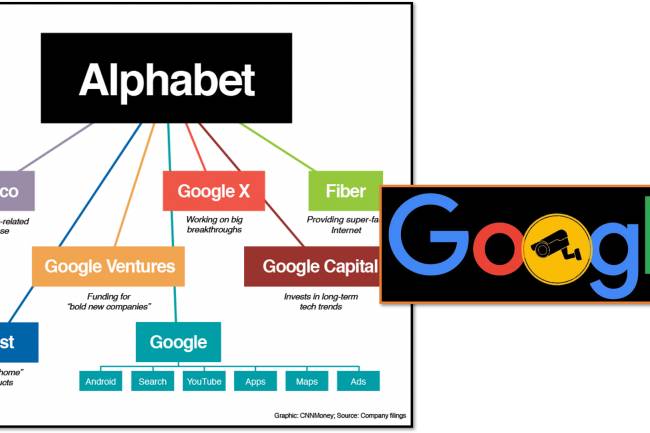
Google history: When Was Google Founded and By Whom?
31.10.2024
0 Comments
free software download websites for pc
21.09.2023
0 Comments
10 Latest PLC Technology Trends
21.10.2023
0 Comments
Magic Spoon Cereal Review
28.10.2023
0 Comments
Categories
AUTO
(23)
HEALTH and Food
(195)
TESTIMONIALS (References)
(0)
SPORTS
(12)
IT and AI
(70)
Accessories
(0)
News
(167)
Pet
(15)
Visiting Place News
(24)
Style and Fashion news
(25)
Geography News
(0)
Entertainment News
(0)
Random Posts
IT and AI
Full-stack development web based
News
Egyptian Perfumery: Perfume History in Egypt
News
Castplus| cost plus world market |world market
HEALTH and Food
Wendy’s Is Offering 1-Cent Jr. Bacon Cheeseburgers
IT and AI
Global ethical guidelines for AI
Tags
intrinsic motivation
NFL scores and milestones 2023
self-awareness
Philipp Lahm
Ethical AI
home spa bath
#EidFeast
Cholesterol reduction
Visual hierarchy
Cost Plus Furniture Sale
Alan Hamel Suzanne Somers Marriage Story
Honda CR-V e:FCEV 2025 Features
umber of rows is even
Python for beginners
AI compliance
Your browser does not support the canvas element.